Training Zones
Training intensity exists on a continuum, with intensity being measured in either speed or power output depending on the endurance sport. Runners and swimmers will use speed or paces, whereas cyclists will use power output. By dividing the training intensity continuum into bands or groups, we get training zones.
There are numerous different methods for setting training zones, however, this article will focus on the 3-zone model as it is based on robust physiological thresholds and is simple to implement. It is the most commonly used model in sports science research and is used by the Loughborough Cycling Academy who conduct their testing in the physiology lab.
Setting Training Zones
Depending on what equipment you have access to, there are different methods for setting training zones. We’ll take a look at two methods: lactate thresholds and critical power or speed.
Lactate Thresholds
The gold standard method for setting training zones is to use lactate thresholds determined from a graded exercise test completed in a lab. As the intensity increases throughout the test, blood lactate concentration rises and the relationship between the intensity of exercise and blood lactate concentration is use to identify lactate thresholds. Lactate testing can be done for running, cycling, rowing, and swimming (with a portable lactate analyser).
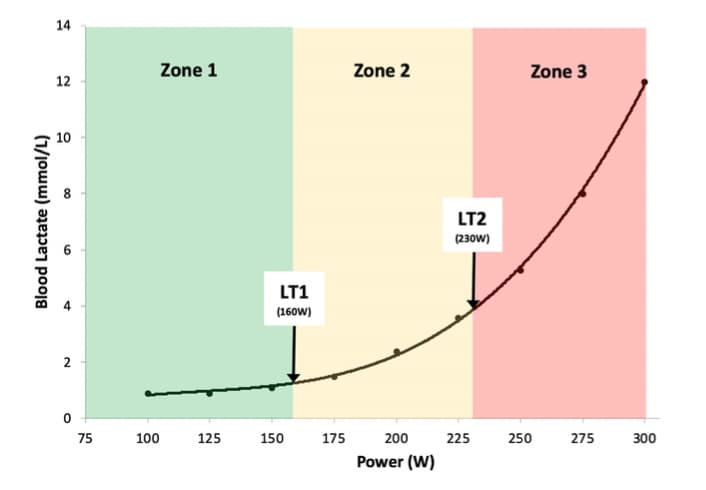
The first lactate threshold, also known as LT1 or the aerobic threshold is used to demarcate zone 1 and 2. LT1 is defined as the lowest intensity at which there is a sustained increase in blood lactate concentration above resting values 1. The second lactate threshold, also known as LT2 or maximal lactate steady state (MLSS) is used to demarcate zone 2 and 3. LT2 is defined as the intensity that causes a rapid increase in blood lactate indicating the upper limit of equilibrium between lactate production and clearance 1.
The figure below shows a cyclist’s results from a lactate threshold test, with the 3-zone model overlaid.

Critical Power Method
If you don’t have access to lactate threshold testing in a lab, using critical power and an estimation of LT1 is another method to set your training zones. This method is primarily targeted at cyclists with access to power output – check below for the critical speed method! Whilst there is debate over whether critical power is analogous to LT2 or MLSS 2, critical power provides a physiological threshold to demarcate zones 2 and 3 3.
To determine your critical power, you can use the following protocol outlined below 4.
Complete a full warm up to prepare yourself for maximal testing efforts.
- Complete a 3-minute time trial, recording the maximal average power you can produce for 3 minutes.
- Rest for 40 minutes.
- Complete a 12-minute time trial, recoding the maximal average power you can produce for 12 minutes.
Based on your 3 and 12-minute time trial power averages, you can use this you can use this link to calculate your critical power .
Ongoing research in the School of Sport, Exercise and Health Sciences at Loughborough University suggests that you can estimate you LT1 based on your critical power result. Based on the data collect so far, LT1 equates to roughly 70-75% of your critical power. For example, a cyclist with a critical power of 300W would have an estimated LT1 of 210W. For more information on this research, check out the recording from the Cycling Science Symposium held at Loughborough last year.
Critical Speed Method
For endurance athletes competing in sports that don’t have the luxury of accurate power measurement, critical speed is a useful alternative that works on the same principles as critical power. Similar to critical power, it provides a clear physiological threshold to delineate between zone 2 and 3. To determine your critical speed, you will need complete an all-out time trial approximately lasting ~3 minutes and another lasting ~12 minutes (these could be taken from race times). The protocol below is a running specific protocol 5.
- Complete a full warm up to prepare yourself for maximal testing efforts.
- Complete a 1200m time trial, recording the duration of the time trial.
- Rest for 30 minutes.
- Complete a 3600m time trial, recording the duration of the time trial.
Based on your distances and durations, you can use this link to calculate your critical speed.
Although the relationship between critical speed and LT1 has not been the subject of the research here at Loughborough, the same relationship likely exists – LT1 equating to 70-75% of critical speed. For example, a runner with a critical speed of 15 km/hr would have an estimated LT1 of ~11 km/hr.
Now What?
So now you’ve set your training zones, you may be asking – what next? Setting training zones has many benefits including (1) the ability prescribe training sessions based on the adaptations you’re trying to elicit and (2) the ability to analyse your training intensity distribution. These are topic we’ll be covering on the website over the coming weeks so be sure to check back for more!
References
- Bourdon (2013) Physiological Tests for Elite Athletes
- Jones et al. (2017) The maximal metabolic steady state: redefining the ‘gold standard’.
- Jones & Vanhatalo (2018) The ‘Critical Power’ Concept: Applications to Sports Performance with a Focus on Intermittent High-Intensity Exercise
- Simpson & Kordi (2016) Comparison of Critical Power and W¢ Derived from Two or Three Maximal Tests.
- Kordi et al. (2019) Comparison of Critical Speed and D' Derived From 2 or 3 Maximal Tests
